library(baseverse)
library(dplyr)
library(ggplot2)
nhanes<-read.csv('nhanes_l.csv')Homework 7
At the top of a new script, include code for loading
basecase,dplyr, andggplot2. Also include code for importing thenhanes_l.csvdata file. Run your code.TipSolutionUse
base_match()to create a labeled version of the original arthritis variable (mcq160a). Values of 1 represent people with a history of arthritis and values of 0 represent people without a history of arthritis. The NHANES documentation formcq106ais available here. List the no group first. Check your work and verify that the groups are listed in the desired order.TipSolutionnhanes$arthritis<-base_match(nhanes$mcq160a,'No'=2,'Arthritis'=1) table(nhanes$mcq160a,useNA='always') #| #| 1 2 9 <NA> #| 2532 5258 17 346 table(nhanes$arthritis,useNA='always') #| #| No Arthritis <NA> #| 5258 2532 363Use
base_when()and the original glucose variable (lbxglu) to define a categorical variable for glucose, using the following definitions:lbxglu< 100 → Normal- 100 ≤
lbxglu< 126 → Prediabetes lbxglu≥ 126 → Diabetes
List the groups in the above order. Check your work and verify that the groups are listed in
table()in the desired order.TipSolutionnhanes$diabetes<-base_when( 'Normal' = nhanes$lbxglu<100, 'Prediabetes' = nhanes$lbxglu>=100 & nhanes$lbxglu<126, 'Diabetes' = nhanes$lbxglu>=126 ) sum(nhanes$lbxglu<100,na.rm=TRUE) #| [1] 1499 sum(nhanes$lbxglu>=100 & nhanes$lbxglu<126,na.rm=TRUE) #| [1] 1401 sum(nhanes$lbxglu>=126,na.rm=TRUE) #| [1] 429 table(nhanes$diabetes,useNA='always') #| #| Normal Prediabetes Diabetes <NA> #| 1499 1401 429 4824Use
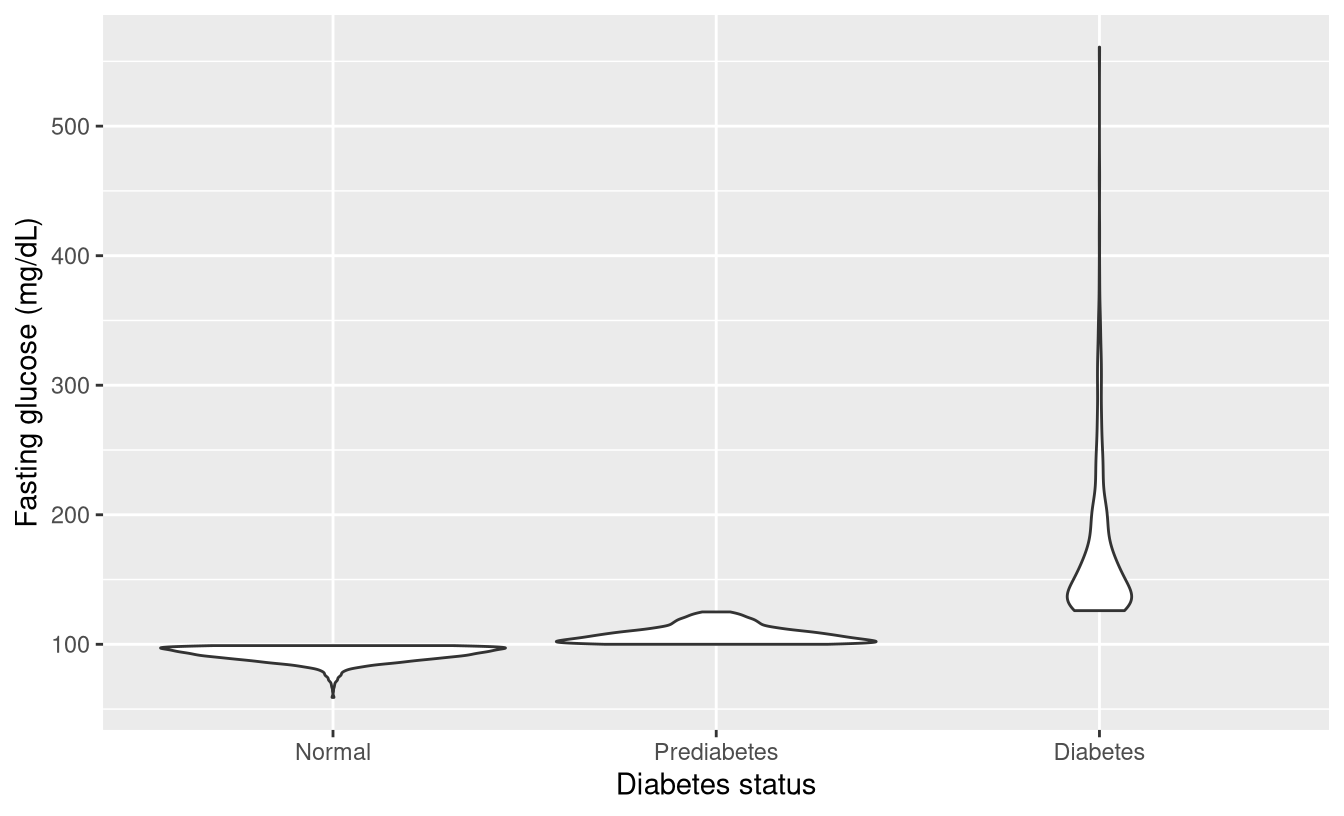
ggplot2to create a violin plot for the new categorical variable (above) versus the continuous glucose variable (lbxglu). Exclude people missinglbxglu. You can interpret your plot as a proof or check of how the categorical variable was defined.TipSolutionggplot(subset(nhanes,!is.na(lbxglu)),aes(x=diabetes,y=lbxglu))+ geom_violin()+ labs(x='Diabetes status',y='Fasting glucose (mg/dL)')