ggplot(nhanes,aes(x=hypertension,y=bpxosy1))+
  geom_violin()+
labs(x='Hypertension',y='Systolic blood pressure (mmHg)')Session 6: How can I subset data and define missing values?
A Slower Introduction to R
Yea-Hung Chen, PhD, MS
UCSF Library
Thursday, November 13, 2025
Restricting to non-missing values
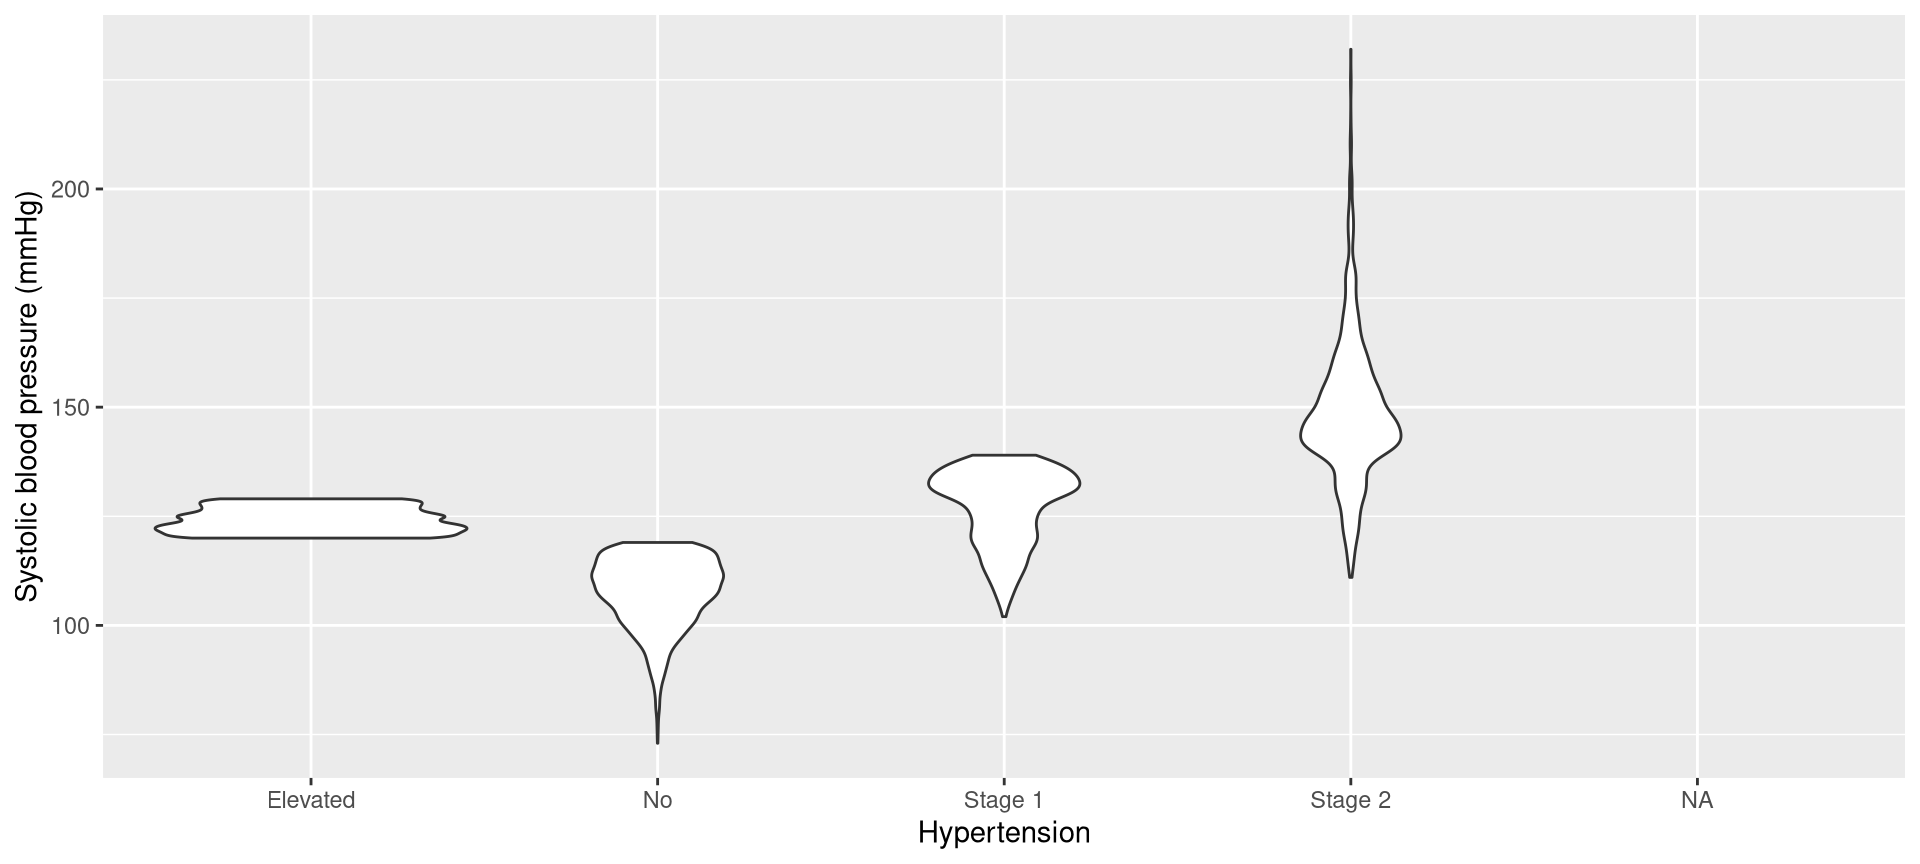
Systolic versus hypertension
- from Exercise 1, last week:
Create a violin plot of systolic blood pressure (
bpxosy1) versus hypertension (hypertension), with systolic blood pressure on the y axis. You can replacegeom_boxplot()above withgeom_violin(). Add labels to the axes usinglabs(). Run your code.
Systolic versus hypertension
Systolic versus hypertension
Terminology
Note
Synonyms of restricting include subsetting and filtering.
Mini data
- as a teaching example, I’ve created a smaller version of the NHANES data
- as always, I encourage you to focus on watching rather than practicing during the mini lectures
- but, here is code for
minidataif you want to work through these examples later:
Mini data
minidata
#|      seqn ridageyr bpxosy1 bpxodi1 hypertension
#| 1  130378       43     135      98      Stage 2
#| 2  130379       66     121      84      Stage 1
#| 3  130380       44     111      79           No
#| 4  130384       43      NA      NA         <NA>
#| 5  130385       65      NA      NA         <NA>
#| 6  130386       34     110      72           No
#| 7  130387       68     143      76      Stage 2
#| 8  130388       27     130      95      Stage 2
#| 9  130389       59     145      76      Stage 2
#| 10 130390       31     113      78           No
Data for individuals not missing hypertension?
- to subset the data to individuals not missing hypertension, use
subset()andis.na():
subset(minidata,!is.na(hypertension))
#|      seqn ridageyr bpxosy1 bpxodi1 hypertension
#| 1  130378       43     135      98      Stage 2
#| 2  130379       66     121      84      Stage 1
#| 3  130380       44     111      79           No
#| 6  130386       34     110      72           No
#| 7  130387       68     143      76      Stage 2
#| 8  130388       27     130      95      Stage 2
#| 9  130389       59     145      76      Stage 2
#| 10 130390       31     113      78           No
is.na()
- the values of
hypertensionare:
is.na()shows whether the values are missing:
- placing an exclamation point in front reverses the values:
subset()
- there are two arguments to
subset()here:minidata: the data I want to subset!is.na(hypertension): a rule defining how I want to subset
subset()will keep rows that areTRUEin the second argument
subset()
- dollar-sign notation is not needed in the second argument
- in
subset(), it is understood that any variable in the second argument is about the data in the first argument
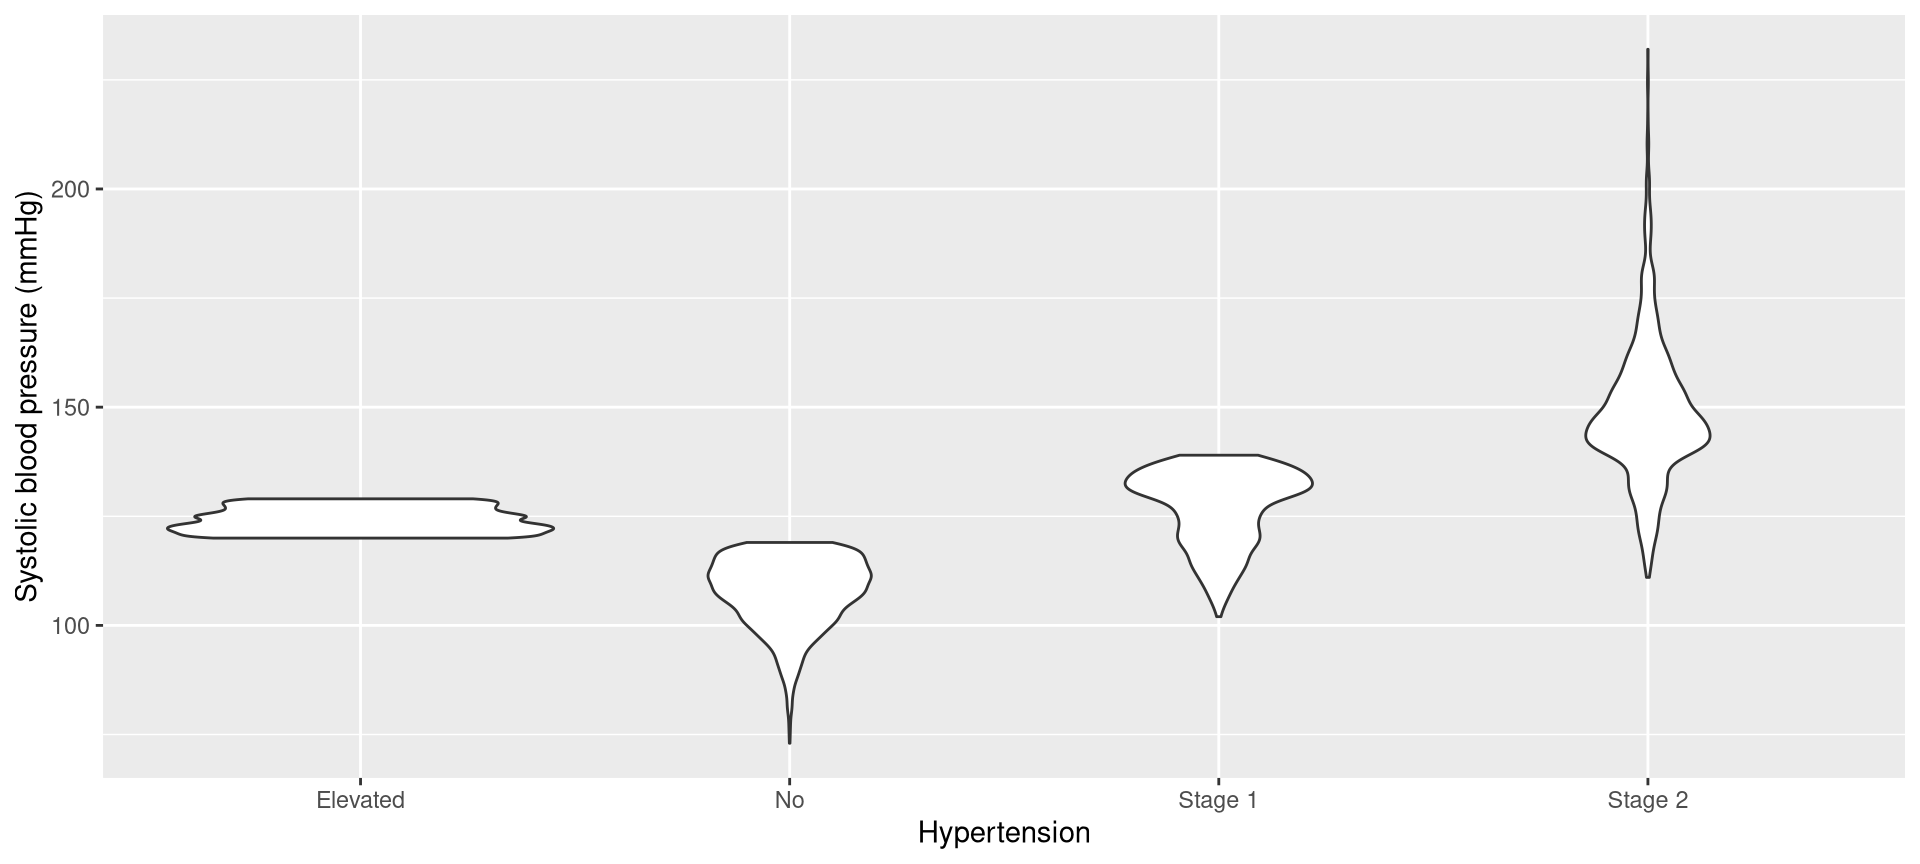
Systolic versus hypertension
Systolic versus hypertension
Exercise 1
Exercise 1
At the top of a new script, include code for loading the
ggplot2package and importing the data. Run your code.Using
ggplot2, create density plots of systolic blood pressure (bpxosy1), with faceting byasthma(defining the rows). Inggplot(), definedatato be a subset of the NHANES data that only includes individuals who are non-missing forasthma.
Numerical comparisons
Data for individuals 60 years of age or older?
- suppose I want to look at the data for just individuals who are 60 years of age or older
Data for individuals 60 years of age or older?
- to subset to individuals 60 years of age or older, use
subset()and a numerical comparison:
Data for individuals 60 years of age or older?
- there are two arguments to
subset()here:minidata: the data I want to subsetridageyr>=60: the rule defining how I want to subset
Numerical comparisons
Numerical comparisons
==for equal!=for not equal>for greater than>=for greater than or equal to<for less than<=for less than or equal to
Numerical comparisons
subset() and numerical comparisons
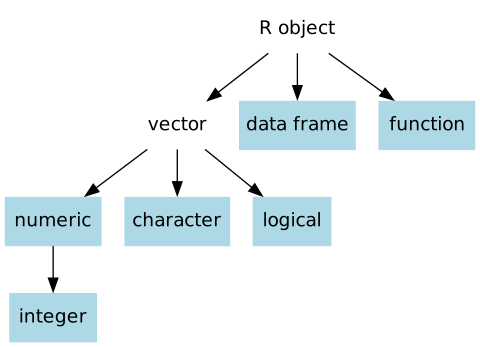
Logical objects
Logical objects
Logical objects
Negation
- to negate (reverse) a logical object, place
!at the beginning
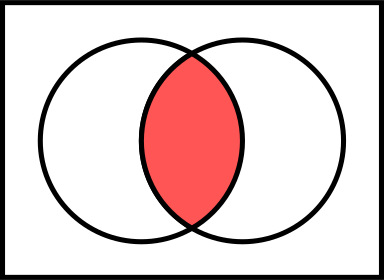
And and or
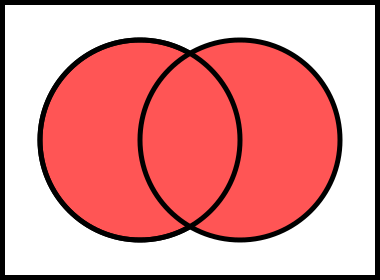
&= and|= or
And
Or
And and or
- individuals without hypertension are partially defined by:
- individuals with Stage 2 hypertension are defined by:
Logical objects and math
- when combining math with logical objects,
TRUEvalues are treated as 1 andFALSEvalues are treated as 0 - this can be very useful
Logical objects and math
- to count missing values:
- or, to count the number of people within an age range:
Exercise 2
Exercise 2
Copy and paste the following code for defining
ex2. Run that code.
Exercise 2
Use
subset()to get the subset ofex2individuals who are between 40 and 49 years of age (ridageyr), inclusive of both endpoints.Use
subset()to get the subset ofex2individuals who have a fasting glucose level (lbxglu) greater or equal to 100 mg/dL and an HDL cholesterol level (lbdhdd) greater or equal to 50 mg/dL.
Exercise 2
Count the number of
ex2individuals who were born in the US (admbdorn4value equal to1) and have a high-school degree (admdedu2value equal to3).Count the number of
ex2individuals who are 50 years of age (ridageyr) or older and have a fasting glucose level (lbxglu) greater or equal to 100 mg/dL.
Exercise 2
Many of the functions for hypothesis testing support a
dataargument. This argument allows you to omit dollar-sign notation. So, these two examples are equivalent:Modify the
dataargument in the second example to examine the relationship between systolic blood pressure and asthma among individuals with a history of smoking (a value ofsmokingequal toHistory of smoking). Remember to omit dollar-sign notation.
Exercise 2
- Using the
dataargument, fit a simple linear regression model for the relationship between systolic blood pressure (bpxosy1) and diastolic blood pressure (bpxodi1), with systolic blood pressure as the y variable, restricting to individuals with a history of smoking. Remember to omit dollar-sign notation.
Defining missing values
Defining new variables
- to define a new variable, use dollar-sign notation and object assignment:
newis an arbitrary name for the new variable
Defining new variables
minidata
#|      seqn ridageyr bpxosy1 bpxodi1 hypertension new
#| 1  130378       43     135      98      Stage 2   1
#| 2  130379       66     121      84      Stage 1   1
#| 3  130380       44     111      79           No   1
#| 4  130384       43      NA      NA         <NA>   1
#| 5  130385       65      NA      NA         <NA>   1
#| 6  130386       34     110      72           No   1
#| 7  130387       68     143      76      Stage 2   1
#| 8  130388       27     130      95      Stage 2   1
#| 9  130389       59     145      76      Stage 2   1
#| 10 130390       31     113      78           No   1
Vigorous physical activity
- from NHANES, the
pad820variable records answers to the question:
About how long {do you/does SP} do these vigorous leisure-time physical activities each time?
Vigorous physical activity
table(nhanes$pad820,useNA='always')
#|
#|    1    2    3    4    5    6    7    8   10   12   15   20   25   30   32   35
#|   12    3    6    2   36    2    1    2  108    5  190  212   30  909    1   12
#|   40   45   46   50   55   60   70   75   90  100  105  120  150  180  240  300
#|   70  262    1   19    3 1064    5   13  145    2    3  364    4   93   49   21
#|  360  420  480  540  600  660  900 7777 9999 <NA>
#|   10    1    8    1    1    1    2    1   13 4466
Vigorous physical activity
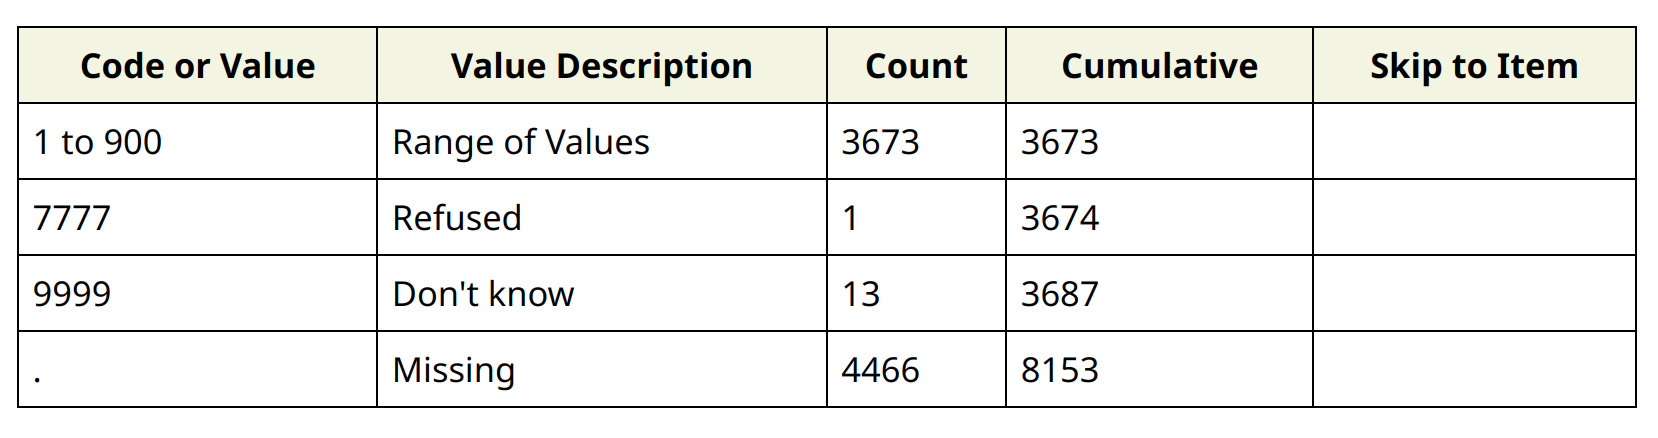
- from NHANES:
Vigorous physical activity
7777and9999are not actual minutes of vigorous physical activity- so, we might want to recode
7777and9999to beNA
Vigorous physical activity
- there are several possible ways to define missing values
- one approach is to use the
replace()function:
Vigorous physical activity
- there are three arguments to
replace()here:nhanes$pad820: the variable that we want to modifynhanes$pad820==7777|nhanes$pad820==9999: a rule (specifically, a logical object) that indicates which values should be replacedNA: the replacement value
Vigorous physical activity
- notice that I defined a new variable,
ltpa_vigorous
Tip
When cleaning variables, define new variables, rather than replacing existing variables.
Vigorous physical activity
- to check the work, use
table():
table(nhanes$ltpa_vigorous,useNA='always')
#|
#|    1    2    3    4    5    6    7    8   10   12   15   20   25   30   32   35
#|   12    3    6    2   36    2    1    2  108    5  190  212   30  909    1   12
#|   40   45   46   50   55   60   70   75   90  100  105  120  150  180  240  300
#|   70  262    1   19    3 1064    5   13  145    2    3  364    4   93   49   21
#|  360  420  480  540  600  660  900 <NA>
#|   10    1    8    1    1    1    2 4480
Tip
Always check your work after doing any data cleaning.
Exercise 3
Exercise 3
pad800stores minutes of moderate physical activity. Values of7777indicate “refused” while values of9999indicate “don’t know” (the codebook is available here). Use object assignment andreplace()to define a new variable for moderate physical activity, with values of7777and9999replaced withNA. Check your work.
Exercise 3
alq130stores responses to the question, “During the past 12 months, on those days that you drank alcoholic beverages, on average, how many drinks did you have?” Values of777indicate “refused” while values of999indicate “don’t know.” Use object assignment andreplace()to define a new alcohol-use variable, with values of777and999replaced withNA. Check your work.
Exercise 3
Install the
baseversepackage, which we will discuss next week:Install the
dplyrpackage, which we will discuss next week: