nhanes$alcohol_use<-nhanes$alq130
is.na(nhanes$alcohol_use)<-(nhanes$alcohol_use==777)|(nhanes$alcohol_use==999)Homework 6
At the top of a new script, include code for loading ggplot2 and for importing the
nhanes_l.csvdata file. Run that code.In Exercise 3, we used
replace()to define missing values for the alcohol-use variable. An alternate way to define missing values is to combineis.na()and object assignment, as shown in the code below.In the first line, we use object assignment to copy the original alcohol-use variable,
alq130, to a new variable,alcohol_use.On the right-hand side of the second line, we use a logical object to define the desired missingness. We then use object assignment to redefine missingness. Notice that
is.na()is on the left-hand side of the object assignment, and recall that it is aTRUE/FALSEvector indicating whether values are missing. (If you are wondering: the object assignment in this line will preserve any existing missingness inalcohol_use, and add the additional missing values defined by the right-hand side.)Copy and paste the above code into your script. Run the code. Verify that the code works as intended.
TipSolutiontable(nhanes$education,useNA='always') #| #| 9th-11th grade College degree or later #| 666 2625 #| Earlier than 9th grade High-school graduate or GED #| 373 1749 #| Some college or AA degree <NA> #| 2370 370 table(nhanes$dmdeduc2,useNA='always') #| #| 1 2 3 4 5 9 <NA> #| 373 666 1749 2370 2625 11 359Use
sum()andis.na()to find the number of people who are missing a value forhypertension. Verify that this matches the number of people who are missingbpxosy1or missingbpxodi1.TipSolutionsum(is.na(nhanes$hypertension)) #| [1] 2030 sum(is.na(nhanes$bpxosy1)|is.na(nhanes$bpxodi1)) #| [1] 2030Use
sum(),is.na(), and negation to find the number of people who are not missing a value of hypertension.TipSolutionsum(!is.na(nhanes$hypertension)) #| [1] 6123Use
sum()and!is.na()to find the number of people who are not missingbpxodi1and not missingbpxodi2.TipSolutionsum(!is.na(nhanes$bpxosy1)&!is.na(nhanes$bpxodi1)) #| [1] 6123Make a violin plot of systolic blood pressure (
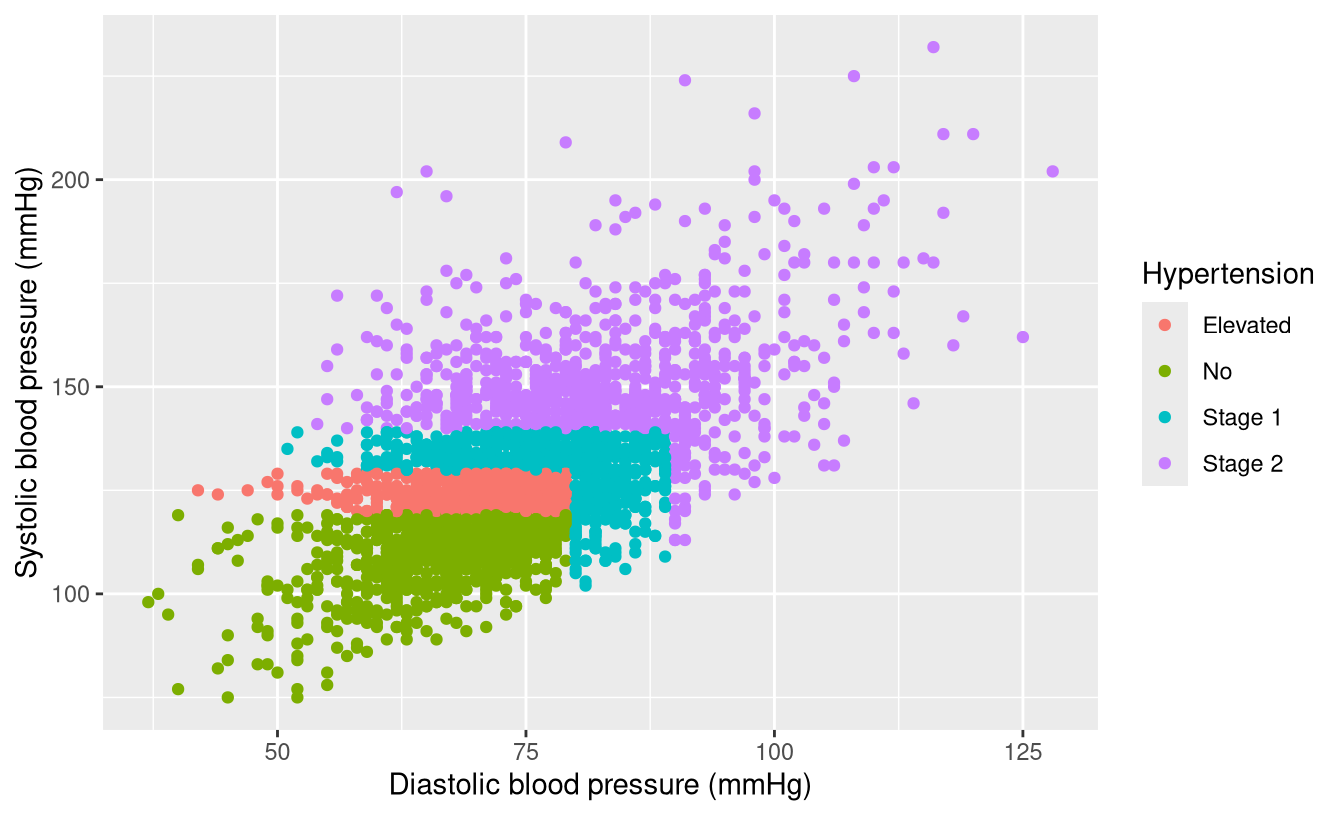
bpxosy1) versus hypertension status (hypertension), but subset the data to individuals who are 60 years of age (ridageyr) or older and omit people who have a missing value ofhypertension.TipSolutionggplot(subset(nhanes,ridageyr>=60&!is.na(hypertension)), aes(x=bpxodi1,y=bpxosy1,color=hypertension))+ geom_point()+ labs(x='Diastolic blood pressure (mmHg)', y='Systolic blood pressure (mmHg)', color='Hypertension')