# load packages
library(ggplot2)

# import data
nhanes<-read.csv('nhanes_l.csv')Homework 5
At the top of a new script, include code for importing the
nhanes_l.csvdata file and for loading ggplot2. Run that code.TipSolutionCopy and paste the following code, which will create a categorical variable for age. Run that code.
nhanes$age4<-(nhanes$ridageyr>=18)+(nhanes$ridageyr>=35)+ (nhanes$ridageyr>=50)+(nhanes$ridageyr>=65) nhanes$age4<-factor(nhanes$age4,1:4,c('18-34','35-49','50-64','65+'))NoteWe’ll talk more about this code in Session 7.
Write code for using ggplot2 to create a density plot for systolic blood pressure (
bpxosy1), with one density curve for each age group, differentiated by color. Add labels to the axes. Run your code.TipSolutionggplot(nhanes,aes(x=bpxosy1,color=age4))+ geom_density()+ labs(x='Systolic blood pressure (mmHg)',y='Density',color='Age')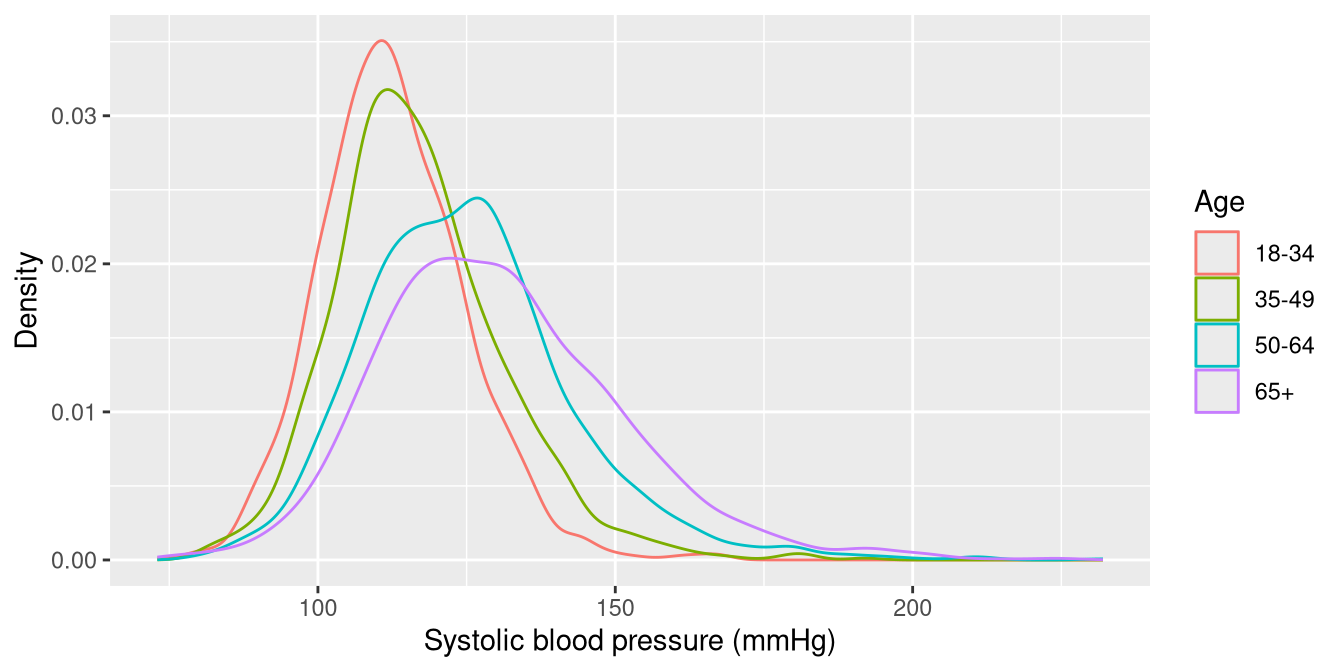
Add faceting by hypertension (
hypertension) and gender (gender), with hypertension defining the rows. For thedataargument inggplot(), you may usesubset(nhanes,!is.na(hypertension))to temporarily remove individuals who are missing a value forhypertension.NoteWe’ll talk more about
subset()in Session 6.TipSolutionggplot(subset(nhanes,!is.na(hypertension)),aes(x=bpxosy1,color=age4))+ geom_density()+ labs(x='Systolic blood pressure (mmHg)',y='Density',color='Age')+ facet_grid(gender~hypertension)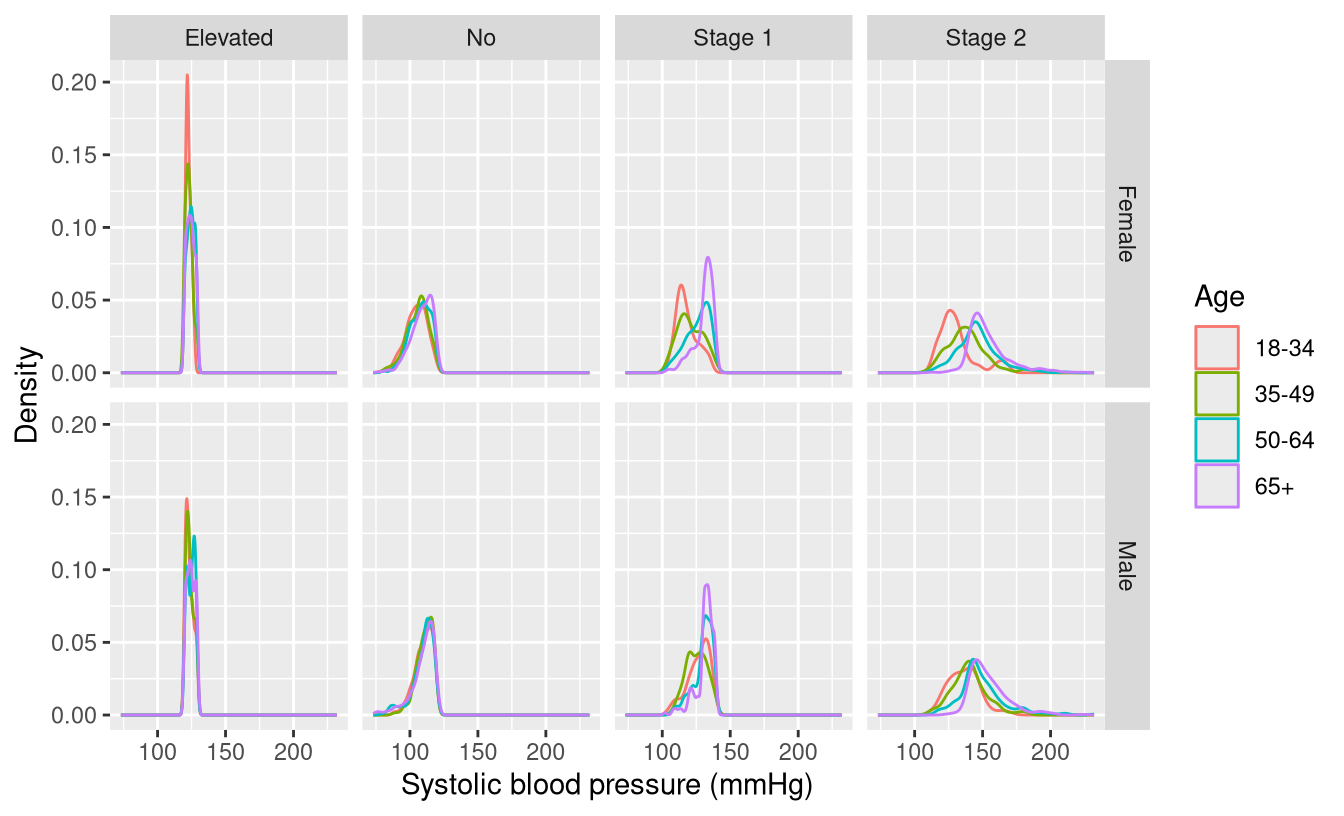
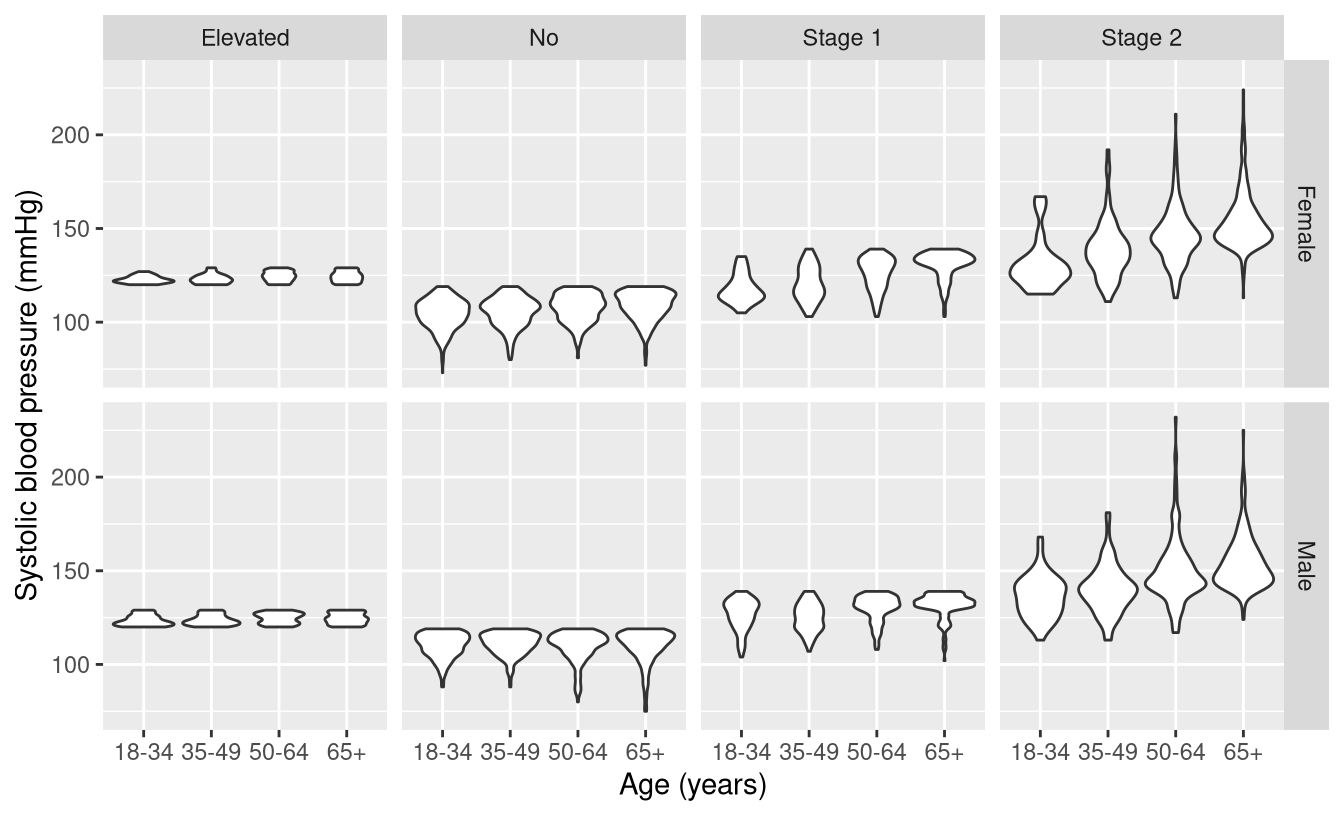
Write code for creating a violin plot for systolic blood pressure (
bpxosy1) versus age group (age4), with systolic blood pressure on the y axis. Add labels to the axes. Add faceting by hypertension (hypertension) and gender (gender), with hypertension defining the rows. For thedataargument inggplot(), you may usesubset(nhanes,!is.na(hypertension))to temporarily remove individuals who are missing a value forhypertension.NoteWe’ll talk more about
subset()in Session 6.TipSolutionggplot(subset(nhanes,!is.na(hypertension)),aes(y=bpxosy1,x=age4))+ geom_violin()+ labs(x='Age (years)',y='Systolic blood pressure (mmHg)')+ facet_grid(gender~hypertension)